The Role of Surface Roughness in Shaping Aerodynamic and Boundary Layer Resistance: Insights into Deposition Velocities and Environmental Modelling

The concept of deposition velocity plays a crucial role in modeling how pollutants transfer from the atmosphere to the surface. This process is controlled by three main resistances: aerodynamic resistance (Ra), boundary layer resistance (Rb), and surface resistance (Rc). Each of these resistances serves a unique purpose and depends on various environmental and physical factors.

The first, aerodynamic resistance (Ra), represents the resistance that air exerts on pollutants moving downwards through the atmosphere. This resistance is influenced by the wind speed and the roughness of the surface, meaning that higher wind speeds and rougher surfaces (such as in urban or forested areas) reduce RaRa, thereby enhancing pollutant transport to the surface. Aerodynamic resistance thus forms the primary pathway for pollutants in the atmosphere, pushing them toward the ground.

Boundary layer resistance (Rb), the second resistance, occurs within a thin layer of air just above the surface. Here, air movement becomes more organized, flowing in layers rather than turbulently. The thickness and resistance of this layer depend on the pollutant properties, as well as environmental conditions like temperature and turbulence. The boundary layer acts as a transitional zone, where deposition slows slightly before pollutants reach the ground.

The final resistance, surface (or canopy) resistance (Rc), depends on how easily the surface itself absorbs the pollutant. For gases like ammonia, specific factors, including surface moisture and the acidity of the land or water, play a large role in this resistance. Surface resistance varies with land type and vegetation; a forest, for example, might absorb pollutants differently than a grassland or water surface. Unlike the previous resistances, which primarily relate to atmospheric conditions, RcRc reflects biological and chemical properties of the surface, influenced by factors such as the leaf area index (LAI), surface moisture, and the respiration rate of plants.

Mathematically calculating the values of Ra and Rb requires several key parameters, with roughness length (z0) and displacement height (d) being particularly important. Roughness length reflects the impact of small-scale surface elements (like crops, grass, or buildings) on air movement, and it varies significantly depending on the land type.

In the Netherlands, for example, agricultural areas generally have a roughness length around 0.1 m, while urban areas measure closer to 1.0 m, and water surfaces show a minimal roughness length near 0.0001 m. Displacement height, on the other hand, represents an effective height above the ground where the average airflow is impacted by obstacles, such as trees or buildings, and is usually set at approximately two-thirds of the height of these roughness elements.

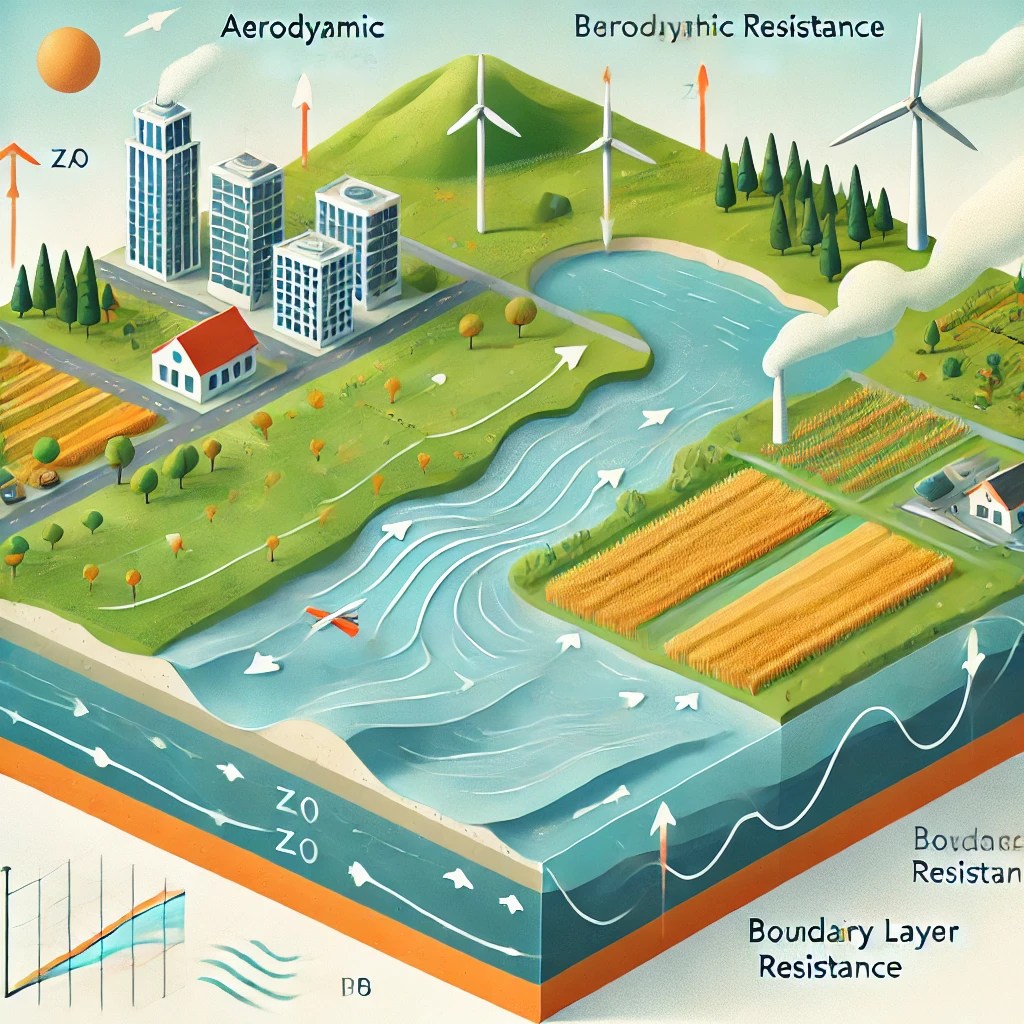
The influence of roughness length and displacement height on aerodynamic and boundary layer resistance can be visualized effectively in a graph, as shown below, which reflects typical values for different land types in the Netherlands.

Although the physics behind aerodynamic and boundary layer resistances is well understood, enabling us to calculate these resistances with relative ease, surface resistance (Rc) remains a complex variable. Its dependency on vegetation type and environmental conditions means it requires further experimental investigation, especially across various types of vegetation and land use. Improved understanding of Rc could significantly enhance the accuracy of deposition models, which are essential for environmental policy and air quality management.

Also about this subject, the following articles:

Understanding Dry Deposition: Mechanisms, Modeling Challenges, and the Complexities of Ammonia’s Interaction with Different Surfaces in Environmental Systems

Dry Deposition – What is it?

When we think of wet deposition, it’s easy to imagine ammonia (or NOx) dissolving in raindrops and falling to the ground in a form that enriches the soil. But what about dry deposition? Molecules like ammonia can’t just “fall” to the ground, nor do they rise on their own. In the previous chapter, we discussed how turbulence in the mixed layer allows for dispersion in all directions. So, if molecules can’t fall, what mechanisms bring ammonia to the ground? The scientific literature is sparse, so we refer to a source called De Vliegende Geest.

The dry deposition flux is determined by the concentration in or on the leaf (in the water layer) and the level of turbulence in the atmosphere. Higher turbulence leads to more transport from the air to the surface. Turbulence itself depends on wind speed, sunlight, and surface roughness. Greater wind speed and roughness increase deposition. Surface roughness varies by terrain: rough surfaces like forests and cities have higher roughness, whereas water has the lowest. Wet surfaces, such as after rainfall or in high humidity, tend to absorb more ammonia.

While this description covers general concepts, it doesn’t fully explain the physical mechanisms that occur just above the ground, allowing the exchange of ammonia gas with the surface. There’s less scientific literature on why this exchange happens. However, we can hypothesize some physical-chemical processes that make dry deposition plausible:

  • Fine particles can fall to the ground, particularly larger ones. Ammonium salts, like ammonium sulfate, can deposit on the ground.
  • The cuticle of plants, a waxy layer on the epidermis, can attract ammonia from the air when wet.
  • Ammonia can be absorbed by plants through stomata under certain conditions, known as the “compensation point.”
  • Moist surfaces like wet clay, sand, or water can absorb ammonia from the air. Depending on acidity or ammonium concentration, a wet surface can also emit ammonia back into the air.

This list isn’t exhaustive, but it shows that dry deposition is a real, complex phenomenon involving many interactions, like the exchange between gaseous ammonia and ammonia dissolved in aerosols. Additionally, ammonia can condense on fine dust particles or adsorb onto them.

The Basis of Dry Deposition Modeling

Dry deposition models rely on accurate concentration measurements above the surface, but ammonia concentrations are challenging to measure via satellites. To overcome this, the Dutch National Institute for Public Health and the Environment (RIVM) uses models (such as Aerius) to predict concentrations above different surfaces.

There are significant discrepancies between predicted and measured ammonia concentrations, which the RIVM sometimes compensates for by inventing emission sources (like ammonia from the sea). Emission sources, especially in agriculture, are not precisely known, and the deposition speed per land type isn’t well understood.

Mathematically, the simplest model assumes a linear relationship between deposition and the concentration difference between the air and the surface. This model uses a fixed deposition speed and can be written as:

Deposition = deposition speed * (air concentration)

More advanced models consider the variability of deposition speed over time and space, incorporating factors like seasons, weather, and surface roughness. These models use an exchange velocity, reflecting that under certain conditions, emissions can occur instead of deposition.

The Resistance Model: Ra + Rb + Rc

The deposition of gases like ammonia is influenced by various resistances that affect the movement of the gas from the atmosphere to the ground. The total resistance is the sum of three components:

  1. Aerodynamic Resistance (Ra): This depends on wind speed and surface roughness. Higher winds and rougher surfaces lower the resistance, increasing the efficiency of air transport to the surface.
  2. Laminar Boundary Layer Resistance (Rb): This occurs in the thin layer of air just above the ground, where air moves in a less turbulent, layered flow. It depends on surface and gas properties like temperature and turbulence.
  3. Surface Resistance (Rc): This reflects how easily the surface absorbs the gas. For ammonia, factors like surface moisture and acidity play a role. Rc is highly dependent on land type, vegetation, and other surface characteristics.

The DEPAC Model for Dry Deposition

Dry deposition is typically calculated using models like DEPAC, which simulate how substances from the air settle on the ground. DEPAC is integrated into the OPS model, widely used to create large-scale deposition maps in the Netherlands. The model incorporates factors like vegetation, surface roughness, and weather to estimate deposition rates.

Recent improvements in the DEPAC model account for ammonia in vegetation and soil, meaning that ammonia can be absorbed and emitted depending on environmental conditions. The model is quite complex, but it offers valuable insights into how different surfaces interact with airborne ammonia.

Conclusion

Dry deposition of ammonia is influenced by many factors, including surface characteristics, turbulence, and atmospheric conditions. Although models like DEPAC provide a way to estimate deposition rates, there is a significant need for more field data and validation to ensure accurate predictions, especially for critical ecosystems like grasslands, forests, and urban areas.